WMTS: Minor Market Fluctuations, US Sees Growth

According to the annual World Machine Tool Survey (WMTS) conducted by Gardner Business Media (publisher of Modern Machine Shop), global machine tool activity in 2023 was rather unremarkable with the US seeing growth across all metrics tracked by the survey.
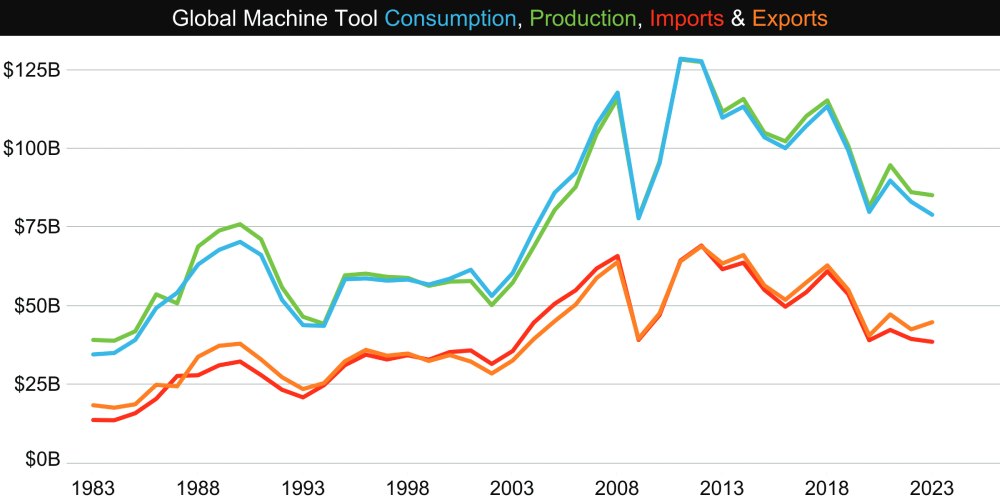
Global machine tool production was fairly stable while consumption fell some 5 percent across the top 50 industrialized countries in 2023. Specifically, overall machine tool consumption decreased from US$ 83.0 billion (B) in 2022 to US$ 79.0 B in 2023 while production decreased a little, from US$ 86.2 B in 2022 to US$ 85.3 B in 2023.
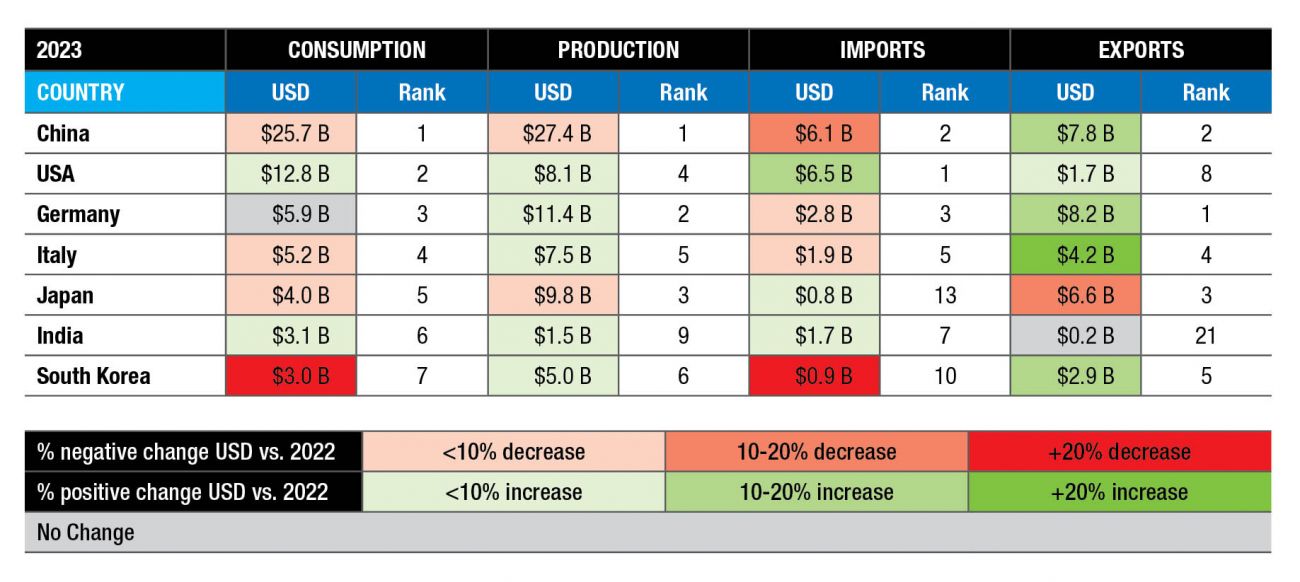
Of the top-10 machine-tool-producing countries, Germany, the United States, Italy, and Spain posted year-over-year gains in real dollars (adjusted for currency exchange rates and inflation) over their 2022 levels, Spain to the tune of +22 percent. On the other hand, China, Japan, and Taiwan posted declines in production, with Taiwan declining the sharpest, to the tune of -20 percent. The US is the only top-10 machine tool-producing country that is also a top-10 machine tool-consuming country and experienced a 5 percent or more increase in consumption.
Spain and Switzerland join the US in being up at least 5 percent in consumption, looking at the top 10 machine tool-producing countries that are also among the top 20 machine tool-consuming countries. Mexico and Turkey enter the top 10 consuming countries, driven primarily by increases in imports.
Of the 2023 top-10 machine tool-consuming countries, half of them post-year-over-year declines in consumption. Taiwan declined the most (-28%) followed by South Korea (-16%).
 Very few countries in the top seven machine tool consumers experienced a steep growth or decline in any particular area, but the US notably experienced growth across all four metrics. |
The World Machine Tool Survey
These data come from the annual World Machine Tool Survey (WMTS) conducted by Gardner Business Media (publisher of Modern Machine Shop). Each year, the survey ranks the world’s top countries in machine tool production, consumption, imports, and exports. For the ranking, Gardner’s Intelligence team takes reported or estimated machine tool economic data and adjusts for exchange rates and inflation to enable year-to-year comparisons in real dollars.
The top-10 producing countries were almost the same in 2023 as in 2022, the only exceptions being Germany and Japan swapping positions, the former taking over the latter for the number-two producer spot in 2023. China (US$ 27.4 B) is far and away the number-one producer, producing nearly 2.5 times as much as Germany (US$ 11.4 B). They were followed by Japan (US$ 9.8 B), the US (US$ 8.1 B), Italy (US$ 7.5 B), South Korea (US$ 5.0 B), Taiwan (US$ 3.2 B), Switzerland (US$ 2.7 B), India and Spain, each at $1.5 B. Germany held its position as top exporter, followed by China, which overtook Japan’s 2022 runner-up slot. Japan, Italy, and South Korea follow in third, fourth, and fifth, with South Korea taking Taiwan’s former position.
China was also the world’s top machine tool consumer by a wide margin at two times the US, US$ 25.7 B versus US$ 12.8 B, respectively. Another big gap in consumption followed behind them, in order, with Germany (US$ 5.9 B), Italy (US$ 5.2 B), Japan (US$ 4.0 B), India (US$ 3.1 B), South Korea (US$ 3.0 B), Mexico (US$ 2.4 B), Turkey (US$ 1.9 B), and Taiwan (US$ 1.3 B).
China fell as top importer in 2023, overtaken by the US and followed by Germany, Mexico, and Italy.
| China (US$ 27.4 B) is far and away the number-one producer, producing nearly 2.5 times as much as Germany (US$ 11.4 B). They were followed by Japan (US$ 9.8 B), the US (US$ 8.1 B), Italy (US$ 7.5 B), South Korea (US$ 5.0 B), Taiwan (US$ 3.2 B), Switzerland (US$ 2.7 B), India and Spain, each at $1.5 B. |
|
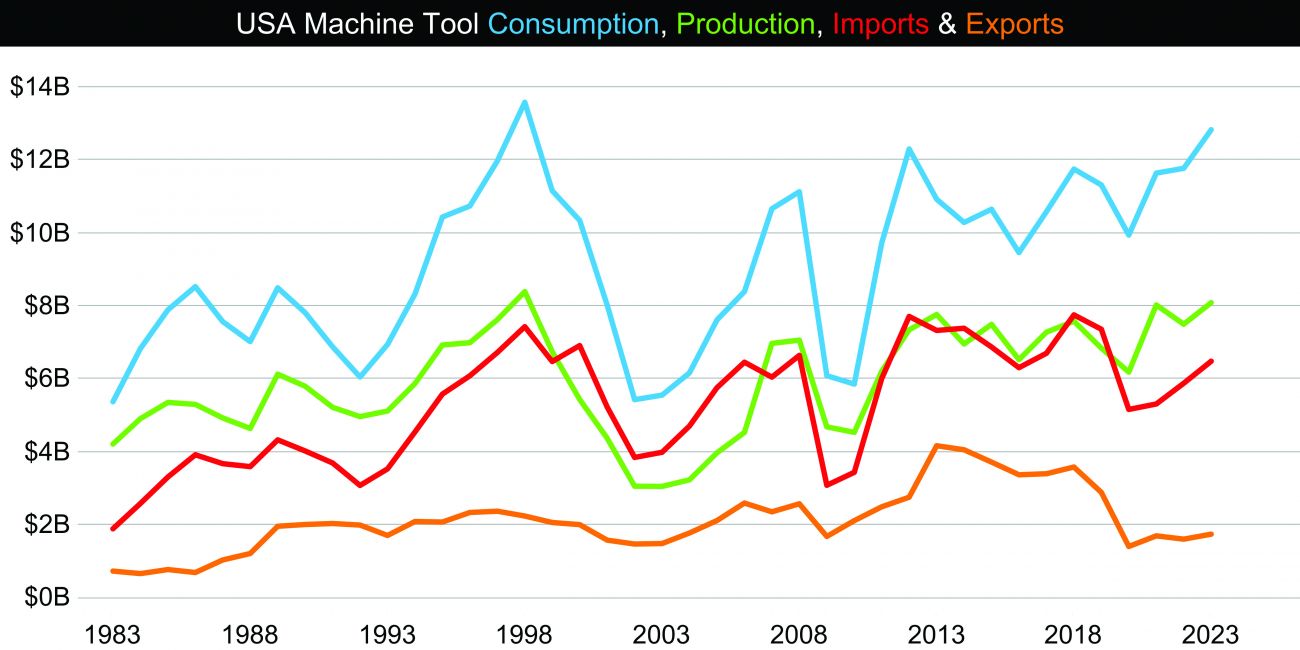
The US experienced growth in all areas measured by the WMTS in 2023, as shown in this graph. Both production and consumption were near the all-time high reached in 1998. |
Analyzing the data
The US is alone among the top six machine tool producers in showing growth across all four areas tracked by the WMTS: consumption, production, imports, and exports. During the 2022-2023 period, the US dollar experienced less inflation than many comparable economies, which may have contributed to the increase in imports and consumption.
Conversely, China and Japan declined across multiple metrics, with both nations seeing declines across three different metrics, including production and consumption. However, China reported strong growth in exports, providing some good news for Chinese OEMs.
The US, China, Germany, Italy, and South Korea all experienced growth in exports over 5 percent, with China’s and Italy’s exports growing by 20 percent or more. Unusually, this growth in exports did not lead to an increase in imports for most of the countries included in our data. In fact, imports fell worldwide, with the numbers diverging sharply from exports. This may indicate that countries that typically go unaccounted for in the WMTS dataset may have increased their machine tool imports. If so, a possible explanation for this change is that countries that have historically had smaller machine tool industries may be shoring up their manufacturing base.
| The US is alone among the top six machine tool producers in showing growth across all four areas tracked by the WMTS: consumption, production, imports, and exports. |
Methodology
This is the 56th edition of an independent, annual survey that collects statistics from countries that produce and consume machine tools, comparing their production and consumption in real US dollars. It is conducted by Gardner Intelligence, the research department of Gardner Business Media Inc. Criteria for inclusion in the report are: 1) the country has imported at least US$ 100 million of machine tools over at least one year since 2001; and 2) the country’s data are provided or reasonable estimates can be calculated. Data are reported for 51 countries in the 2023 report. Total import, export, and production data are provided by, or estimated for, each country. Consumption is calculated by adding imports and production, then subtracting exports. The data typically are reported in local currencies, and then converted to US dollars. Historic data are adjusted for inflation using the U.S. Bureau of Labor Statistics’ Producer Price Index for capital equipment. This adjustment promotes more accurate comparisons over time.
For countries that do not report total imports and exports, data from the International Trade Centre (ITC) are used. ITC data are also used to report imports and exports at the machine tool category level for all countries. Estimates are calculated for production when data are not provided. Imports and exports at the machine tool category level typically sum to numbers less than or equal to the corresponding totals reported. Differences are driven by reporting the top five rather than all eight machine tool categories. In rare instances, imports and exports at the machine tool category level sum to numbers higher than the corresponding totals reported, likely a function of the machine tool category level data including parts and components that are not included in totals. This discrepancy can also be an artifact of using different data sources.
Source: MMS
 |
ELI PLASKETT Senior Associate Editor Modern Machine Shop |


 Facebook
.png) Twitter
Twitter Linkedin
 Subscribe